About
Regions of high-dimensional input spaces that are underrepresented in training datasets reduce machine-learnt classifier performance, and may lead to corner cases and unwanted bias for classifiers used in decision making systems. When these regions belong to otherwise well-represented classes, their presence and negative impact are very hard to identify. We propose an approach for the detection and mitigation of such rare subclasses in deep neural network classifiers. The new approach is underpinned by an easy-to-compute commonality metric that supports the detection of rare subclasses, and comprises methods for reducing the impact of these subclasses during both model training and model exploitation. We demonstrate our approach using two well-known datasets, MNIST's handwritten digits and Kaggle's cats/dogs, identifying rare subclasses and producing models which compensate for subclass rarity. In addition we demonstrate how our run-time approach increases the ability of users to identify samples likely to to misclassified at run-time.
Approach
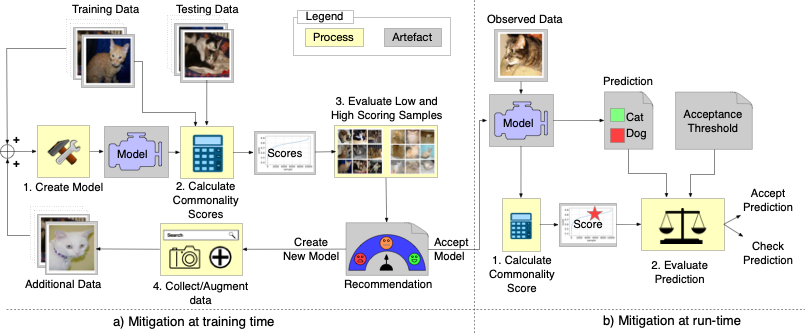
This website provides supplementary information for our paper which proposes an approach for the detection and mitigation of rare subclasses in deep neural network (DNN) classifiers. Our approach comprises:
- A method for the efficient computation of acommon-ality metric. Applied to a sample from the test set oran unlabelled sample being classified by the DNN, thismetric indicates how frequently data samples with similarcharacteristics were encountered in the training dataset.
- A method that applies our new metric to the test dataset, todetect rare subclasses, supporting the augmentation of thetraining dataset with additional samples representative ofthese subclasses. Used during the model learning stage of ML lifecycle, this method improves the DNN perfor-mance both for the (previously) rare subclass and overall.
- An online method that applies our commonality metricto unlabelled samples being classified, to identify sampleswith characteristics potentially unseen during training. Ob-taining a second opinion for the few such samples (from analternative, higher-cost classifier such as a human operator)can significantly reduce the number of classification errors.
Illustration of subclass rarity
In order to illustrate the impact of sub-class rarity on misclassification rates we constructed a simple neural network model to identify odd and even numbers from the MNIST data set [Yann LeCun. The MNIST database of handwrittendigits. http://yann.lecun.com/exdb/mnist/, 1998].
The data was labelled such that each of the two classes had 5 sub-classes, Even = {0,2,4,6,8} and Odd = {1,3,5,7,9}. A neural network was constructed with a single fully connected layer of 100 neurons using the ReLU activation function and an output layer using a softmax function over the two possible classes.
To synthesize a rare sub-class we selected each digit in turn and discarded each instance of the digit from the data set with a probability of 0.8 i.e. the number of samples for an individual digit when selected to be rare was reduced from 10,000 to approx 2,000. Using this reduced data set we trained our model and then assessed the miss-classification rate for each digit in the set.
We repeated this experiment 30 times for each digit plotting the results with the mean misclassification rate of rare digits shown in blue and the rate associated with common digits shown in red.
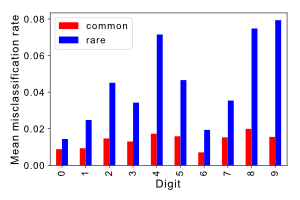
While the rate varies significantly as a function of the subclass it is clear that for all digits misclassification is more likely if they are rare. Indeed if we calculate the ratio between rare and common subclass misclassification as:

we see that class zero is least impacted with a ratio of 1.6 and class nine is most affected being 5.1 times as likely to be misclassified.
Models used for evaluation
Throughout the paper we use two case studies for the evaluation of our rarity detection and mitigation approach. The two data sets and the details of the models used are provided in the following table.
| MNIST | Cats and Dogs | |
|---|---|---|
| Training Set Size | 60,000 | 25,000 |
| Testing Set Size | 10.000 | 4989 |
| Image Type | Grayscale 28x28 | RGB size varies |
| Number of classes | 10 | 2 |
| Model Structure | ||
| Layer 1 | Conv(32) | Conv(32), BatchNorm, MaxPool, DropOut |
| Layer 2 | Conv(64), MaxPool, DropOut | Conv(64), BatchNorm, MaxPool, DropOut |
| Layer 3 | Dense(128), DropOut | Conv(64), BatchNorm, MaxPool, DropOut |
| Layer 4 | SoftMax(10) | Dense(512), BatchNorm, DropOut |
| Layer 5 | - | SoftMax(2) |
| Trainable Parameters | 1,199,882 | 12,942,786 |
| Validation accuracy | 0.9913 | 0.8953 |
Run-time Mitigation
To evaluate the use of the commonality score at run-time we considered the Cats/Dogs model and the 6934 unlabelled test images which had not previously been used for development or testing. These images were then classified using the original model, i.e. the model before the addition of additional white cats.
We calculated an acceptance threshold based on the quartiles derived from the training data. When applied to the unlabelled test set 247 images were identified as having a commonality score below the threshold. Each of the samples were then inspected by a human to verify the validity of the predicted class. The results of this inspection is available as a PDF document, and an extract is shown below. The label below an image indicates the predicted class with misclassified images indicated with a red border and an asterix on the label.
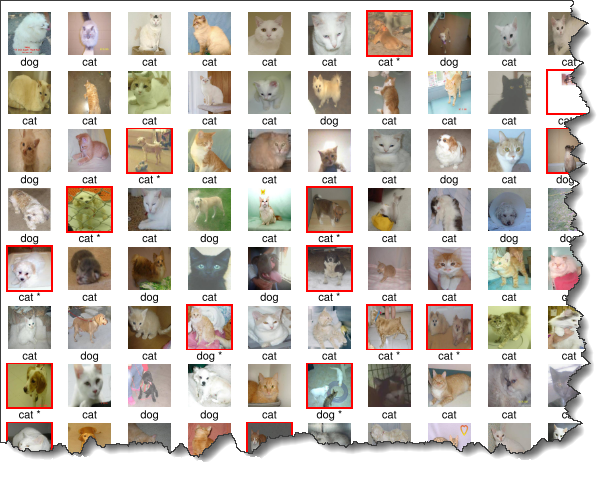
Since the test accuracy of the model reported by the training and testing procedure is 0.8946 we would expect to find approximately 26 misclassified samples in a set of 247 images drawn randomly from the test set. In the set identified by out method we instead found 42 misclassified samples, 61% more samples than expected. Without the commonality score we would have expected to inspect 398 samples to find this number of misclassifications. For the samples with a low commonality score the model accuracy is 0.8299, again showing that in samples with low commonality scores accuracy is reduced and misclassification rates increased.